
Devices designed to monitor the composition and conditions of enclosed spaces measure airborne particles, gas concentrations, and basic environmental parameters. These instruments generally use optical, electrochemical, or sorptive detection methods to convert physical or chemical presence into electronic signals. Typical outputs include particle counts by size fraction, concentrations of carbon-containing gases, relative humidity, and temperature. Data from these monitoring systems aim to describe the state of an interior environment at a given time or over a period, supporting assessment and comparison rather than providing definitive diagnoses or health claims.
Measurement components commonly found in such monitoring equipment include laser-based counters for particulate matter, nondispersive infrared modules for carbon dioxide, metal-oxide or photoionization detectors for volatile organic compounds, and sensors for temperature and humidity. Each component has operating limits, response times, and sensitivities that vary by technology and application. Readings may be influenced by factors such as airflow, recent activities (cooking, cleaning), and sensor drift, so interpretation often requires context and, in some cases, comparison with reference measurements or log histories.
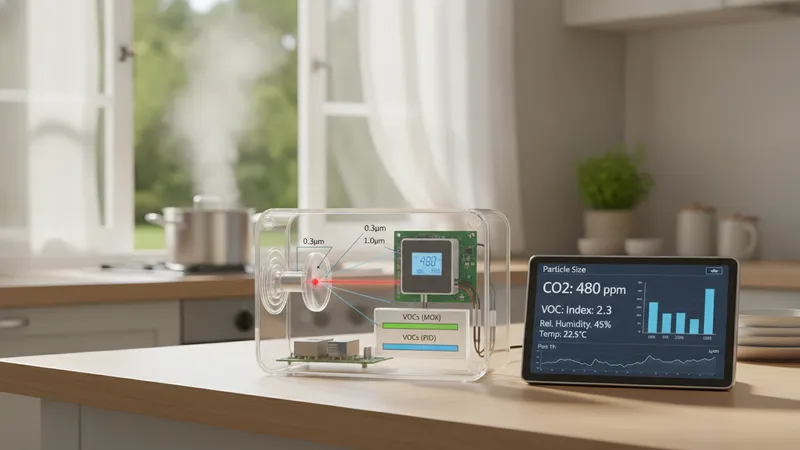
Optical particle counters and CO2 modules often serve different diagnostic roles: particle counters may indicate sources like combustion or resuspension of dust, whereas CO2 levels can reflect occupancy and ventilation. Photoionization detectors typically respond to a broad class of organic gases but may vary in sensitivity across compounds, so reported VOC indices are usually comparative rather than absolute for individual chemicals. Cross-sensitivity among gases, environmental effects like humidity, and sensor aging all affect readings. In practice, combining data streams can provide a more comprehensive picture than any single metric alone.
Calibration and verification are important considerations. Some sensors include factory calibration with documented tolerances, while others may drift and require periodic checks against a calibrated reference instrument. Calibration intervals can vary by sensor type and usage intensity; for some electrochemical cells or optical counters, annual verification may be common, while other modules could need more frequent attention. Traceability to known standards or reference devices helps maintain comparability over time, and documented calibration records support consistent interpretation when monitoring over months or years.
Placement strategies typically influence the usefulness of measurements. Sensors placed near emission sources, vents, or windows may show localized values that differ from representative room-level conditions. Mounting a unit at breathing zone height and away from direct airflow or immediate sources often yields data that are more representative of occupant exposure. For portable or short-term assessments, moving a sensor through different zones can reveal spatial variability. Users often consider multiple sampling points in larger spaces to account for heterogeneity rather than relying on a single location.
Data presentation and logging features can affect how readings are used for analysis. Devices that store time-stamped records facilitate trend analysis and correlation with activities or external conditions. Some units provide simple indices or color-coded ranges to help interpret fluctuations, while others export raw values for statistical evaluation. When evaluating time series, analysts often account for short-term spikes versus sustained elevated levels; short spikes may reflect transient events, whereas persistent elevations can indicate underlying ventilation or source issues. The next sections examine practical components and considerations in more detail.
Different measurement technologies address varied aspects of indoor environments. Optical particle counters use laser scattering to size and count particles and often convert counts to estimated mass concentrations for PM1.0, PM2.5, and PM10. Nondispersive infrared (NDIR) modules absorb infrared light at specific wavelengths to quantify carbon dioxide in parts per million. Electrochemical sensors detect gases such as carbon monoxide through chemical reactions that generate measurable current. Photoionization detectors (PIDs) ionize volatile organics using ultraviolet light, producing a signal proportional to the sum of ionizable compounds present. Each approach has trade-offs in sensitivity, selectivity, lifespan, and cost.
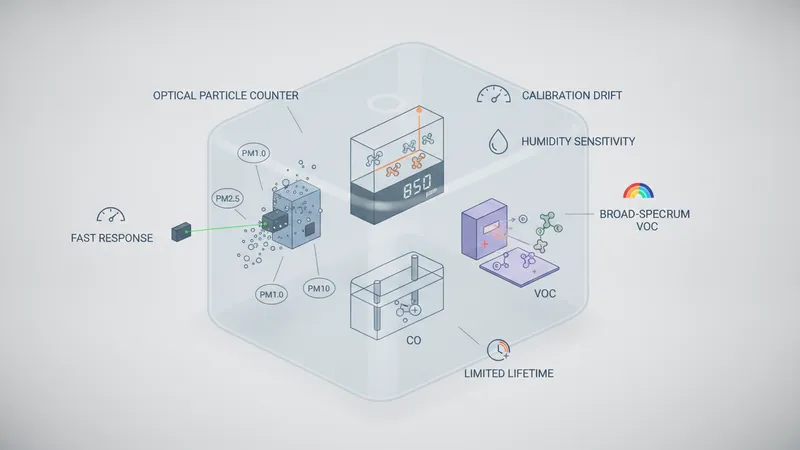
Performance characteristics commonly differ by technology. Optical counters typically respond rapidly to particle changes but may be influenced by particle composition and humidity when converting counts to mass. NDIR CO2 sensors are often stable for months but can exhibit calibration drift over long deployments or after exposure to high concentrations. Electrochemical cells for gases can have limited lifetimes and may require replacement at defined intervals. PIDs detect a broad VOC spectrum but do not easily differentiate individual chemicals without complementary sampling or lab analysis. Understanding these characteristics helps set expectations for data interpretation.
Selection for a given use case tends to match the parameter of interest to an appropriate sensing method. For occupancy and ventilation assessment, CO2 detection is frequently used because concentration trends may correlate with exhaled breath accumulation. For combustion or infiltration concerns, particle counters are often chosen to observe fine particulate trends. For detecting chemical emissions or off-gassing, PID or sorbent-based sampling followed by laboratory analysis may be appropriate. In many settings, integrated monitors that combine multiple sensor types may provide cross-relevant context without implying definitive identification of specific sources.
Practical considerations include sensor response time, detection limits, and environmental tolerances. Rapid response supports identifying transient events, while lower detection limits facilitate monitoring background concentrations. Temperature and humidity ranges influence sensor stability and may require compensation algorithms or protective enclosures. Power, data connectivity, and physical size also factor into deployments: battery-operated units can enable temporary assessments, whereas wired or networked instruments may be preferred for continuous integration into building management data streams. Readers may review manufacturer specifications and independent evaluations when assessing trade-offs.
Particulate measurements often report mass concentrations for size fractions such as PM2.5 and PM10 or particle counts within size bins. Elevated fine-particle readings may stem from combustion activities, outdoor infiltration, or resuspension of settled dust. Trends over time can indicate whether increases are episodic or persistent. Carbon dioxide is commonly reported in parts per million; higher sustained indoor concentrations can suggest limited ventilation relative to occupancy, though CO2 itself is one indicator among several and does not quantify specific contaminants. Both particulate and gas measurements often require contextual information for meaningful interpretation.
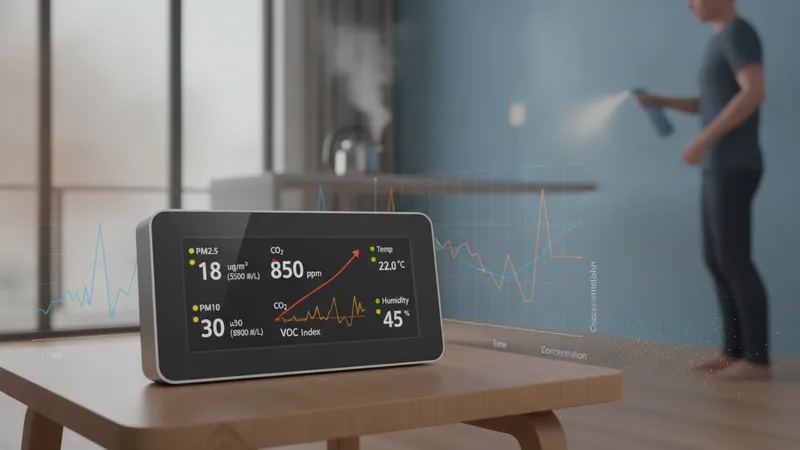
Volatile organic compound measurements vary by sensor type and reporting method: PIDs and metal-oxide detectors may provide a composite VOC index or relative signal rather than concentrations for individual chemicals. That composite signal can indicate the presence or fluctuation of organic emissions from activities such as cleaning, painting, or off-gassing from materials. Temperature and relative humidity readings help interpret sensor performance and occupant comfort context; humidity can also influence particle hygroscopic growth, affecting size and optical detection. Using multiple metrics together often yields a clearer understanding than single-parameter readings.
Thresholds and comparative references are often used cautiously. Many organizations and studies report ranges that are commonly observed in occupied buildings, but there is no universal single threshold that applies across all environments and contaminants. Short-term spikes in particulates or VOCs may occur during specific activities and then subside, while persistent elevations may indicate ongoing sources or inadequate ventilation. Analysts may compare indoor measurements to outdoor baselines or historical indoor averages to assess anomalies, keeping in mind that interpretation should consider context, sensor limitations, and measurement uncertainty.
Time series analysis usually clarifies patterns that instantaneous readings cannot. Diurnal patterns, occupancy-correlated changes, and responses to interventions can be evident when data are logged at regular intervals. For instance, particle counts may rise during cooking periods and return toward baseline afterward, whereas continuously elevated gas or particle levels could suggest a background source. Data smoothing, moving averages, or event tagging can assist interpretation. Users typically treat sensor outputs as indicators that may prompt further investigation rather than as definitive proof of specific conditions.
Proper placement can substantially influence measurement representativeness. Positioning a unit roughly at breathing zone height, away from direct airflow of HVAC supply vents and without immediate proximity to doors or windows, often yields readings that are more indicative of typical occupant exposure. Placing sensors near known or suspected sources may be useful for source identification rather than general monitoring. For larger rooms, multiple sampling points may be necessary to capture spatial variability. When conducting comparative assessments, maintaining consistent placement and environmental conditions across measurements supports more reliable comparisons.
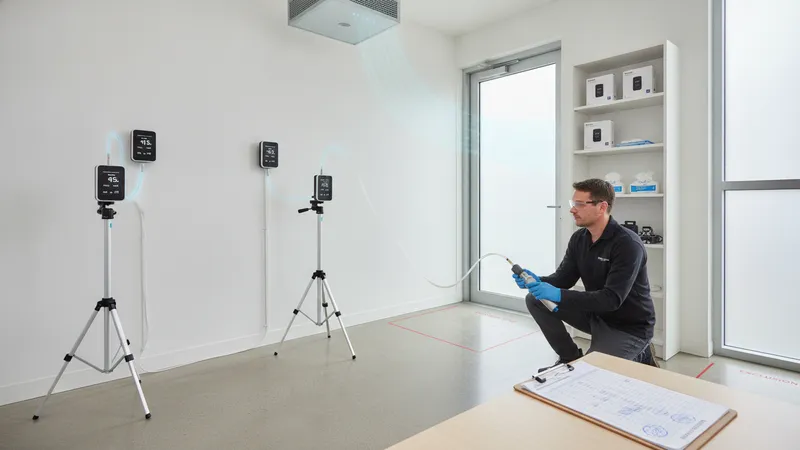
Calibration practices vary by sensor technology and intended use. Some devices include field calibration routines or reference gas ports, while others may rely on factory calibration with recommended verification intervals. For research-grade comparisons, periodic reference checks against a calibrated instrument are common practice. Drift, sensor aging, contamination, and environmental extremes can all alter response over time. Users often document calibration dates and any adjustments to maintain a history that supports interpretation of long-term trends and helps distinguish sensor changes from environmental changes.
Environmental factors can affect sensor reliability and should be considered during deployment. High humidity may impact optical measurements and some gas sensors; temperature extremes can shift baseline responses. Aerosol composition influences optical sizing and mass estimation, so conversions from counts to mass often rely on assumed particle densities and refractive indices that may not hold for all sources. Regular maintenance such as cleaning inlets and replacing filters or desiccants when specified can reduce measurement artifacts. Planning deployments with environmental constraints in mind helps improve data quality.
Documenting procedural context enhances the value of measurements. Recording occupancy, activities (cooking, cleaning, renovation), HVAC operation status, and outdoor conditions at sampling times allows later correlation and aids interpretation. For periodic assessments, consistent logging protocols support temporal comparisons. When evaluating intervention outcomes or building performance, paired before-and-after measurements under similar conditions are typically more informative than isolated snapshots. Readers may consider these deployment and calibration aspects as part of a systematic approach to generating useful and comparable data.
Data management choices influence the usefulness of sensor outputs. Devices that log time-stamped data facilitate trend analysis and correlation with activities or environmental events. Connectivity options range from local storage to networked cloud services; each has trade-offs for accessibility, privacy, and long-term archiving. When exporting data for analysis, retaining raw values alongside any processed indices supports transparency. Analysts often apply simple descriptive statistics, moving averages, or event markers to better distinguish transient spikes from sustained conditions, acknowledging the limits of each sensor’s precision and accuracy.
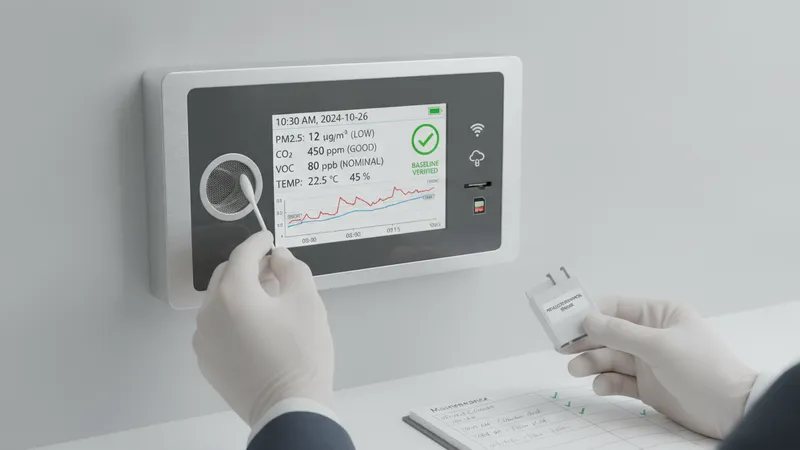
Maintenance routines typically include periodic checks, cleaning, and component replacement according to manufacturer guidance or observed performance changes. Optical inlets may require gentle cleaning to avoid altered optical paths; electrochemical and PID elements may have finite service lives and specified replacement intervals. Maintaining a log of maintenance actions helps identify whether changes in readings stem from environmental shifts or equipment servicing. Regular verification of baseline behavior after maintenance can help confirm that the sensor continues to operate within expected response characteristics.
Integration with building systems can expand context but also requires careful configuration. Networked sensors may feed building management systems or data dashboards that aggregate multiple inputs; consistent calibration and synchronized timestamps aid in correlating signals. Privacy considerations arise when occupancy-related metrics are combined with identifiable usage data; anonymization and limited data retention are common mitigations. Interoperability standards and open data formats may ease long-term analysis and reduce vendor lock-in concerns when selecting systems for monitoring and research purposes.
Interpreting results benefits from a cautious, evidence-based approach. Sensor outputs commonly serve as indicators that prompt further investigation or more detailed sampling rather than as conclusive proof of specific causes. Cross-referencing multiple parameters, documenting contextual factors, and using reference comparisons are practices that often improve confidence in interpretation. Over time, consistent measurement protocols and careful maintenance typically yield datasets that are more useful for trend analysis and decision support in built environments.